Geographic focus
Anchored in Buffalo. Disciplined expansion.
Abbotsinch established its presence in Buffalo in 2009 on the strength of affordability, demand and economic resilience. Our experience here has informed selective entry into adjacent Northeast markets with comparable fundamentals.
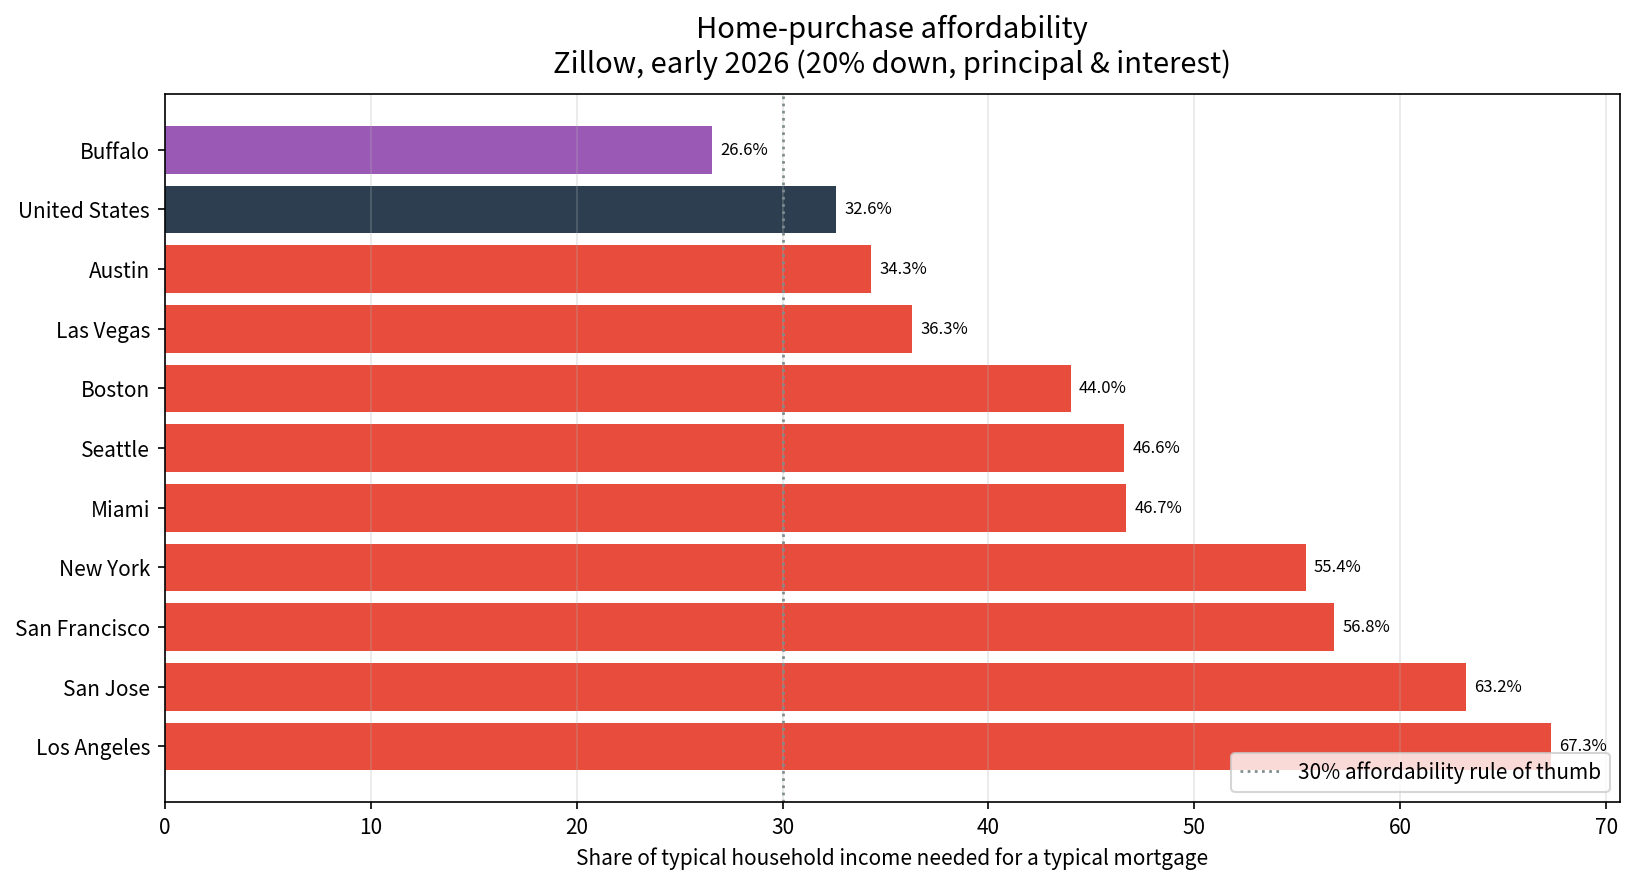
Buffalo is affordable
A typical Buffalo metro house is about 21% cheaper than the US typical home; a typical city sale is closer to half the price of a US home; and a workaday Buffalo double can cost what a deposit does in New York, San Jose, Los Angeles — or London and Toronto.
 Tap the chart to view it full size
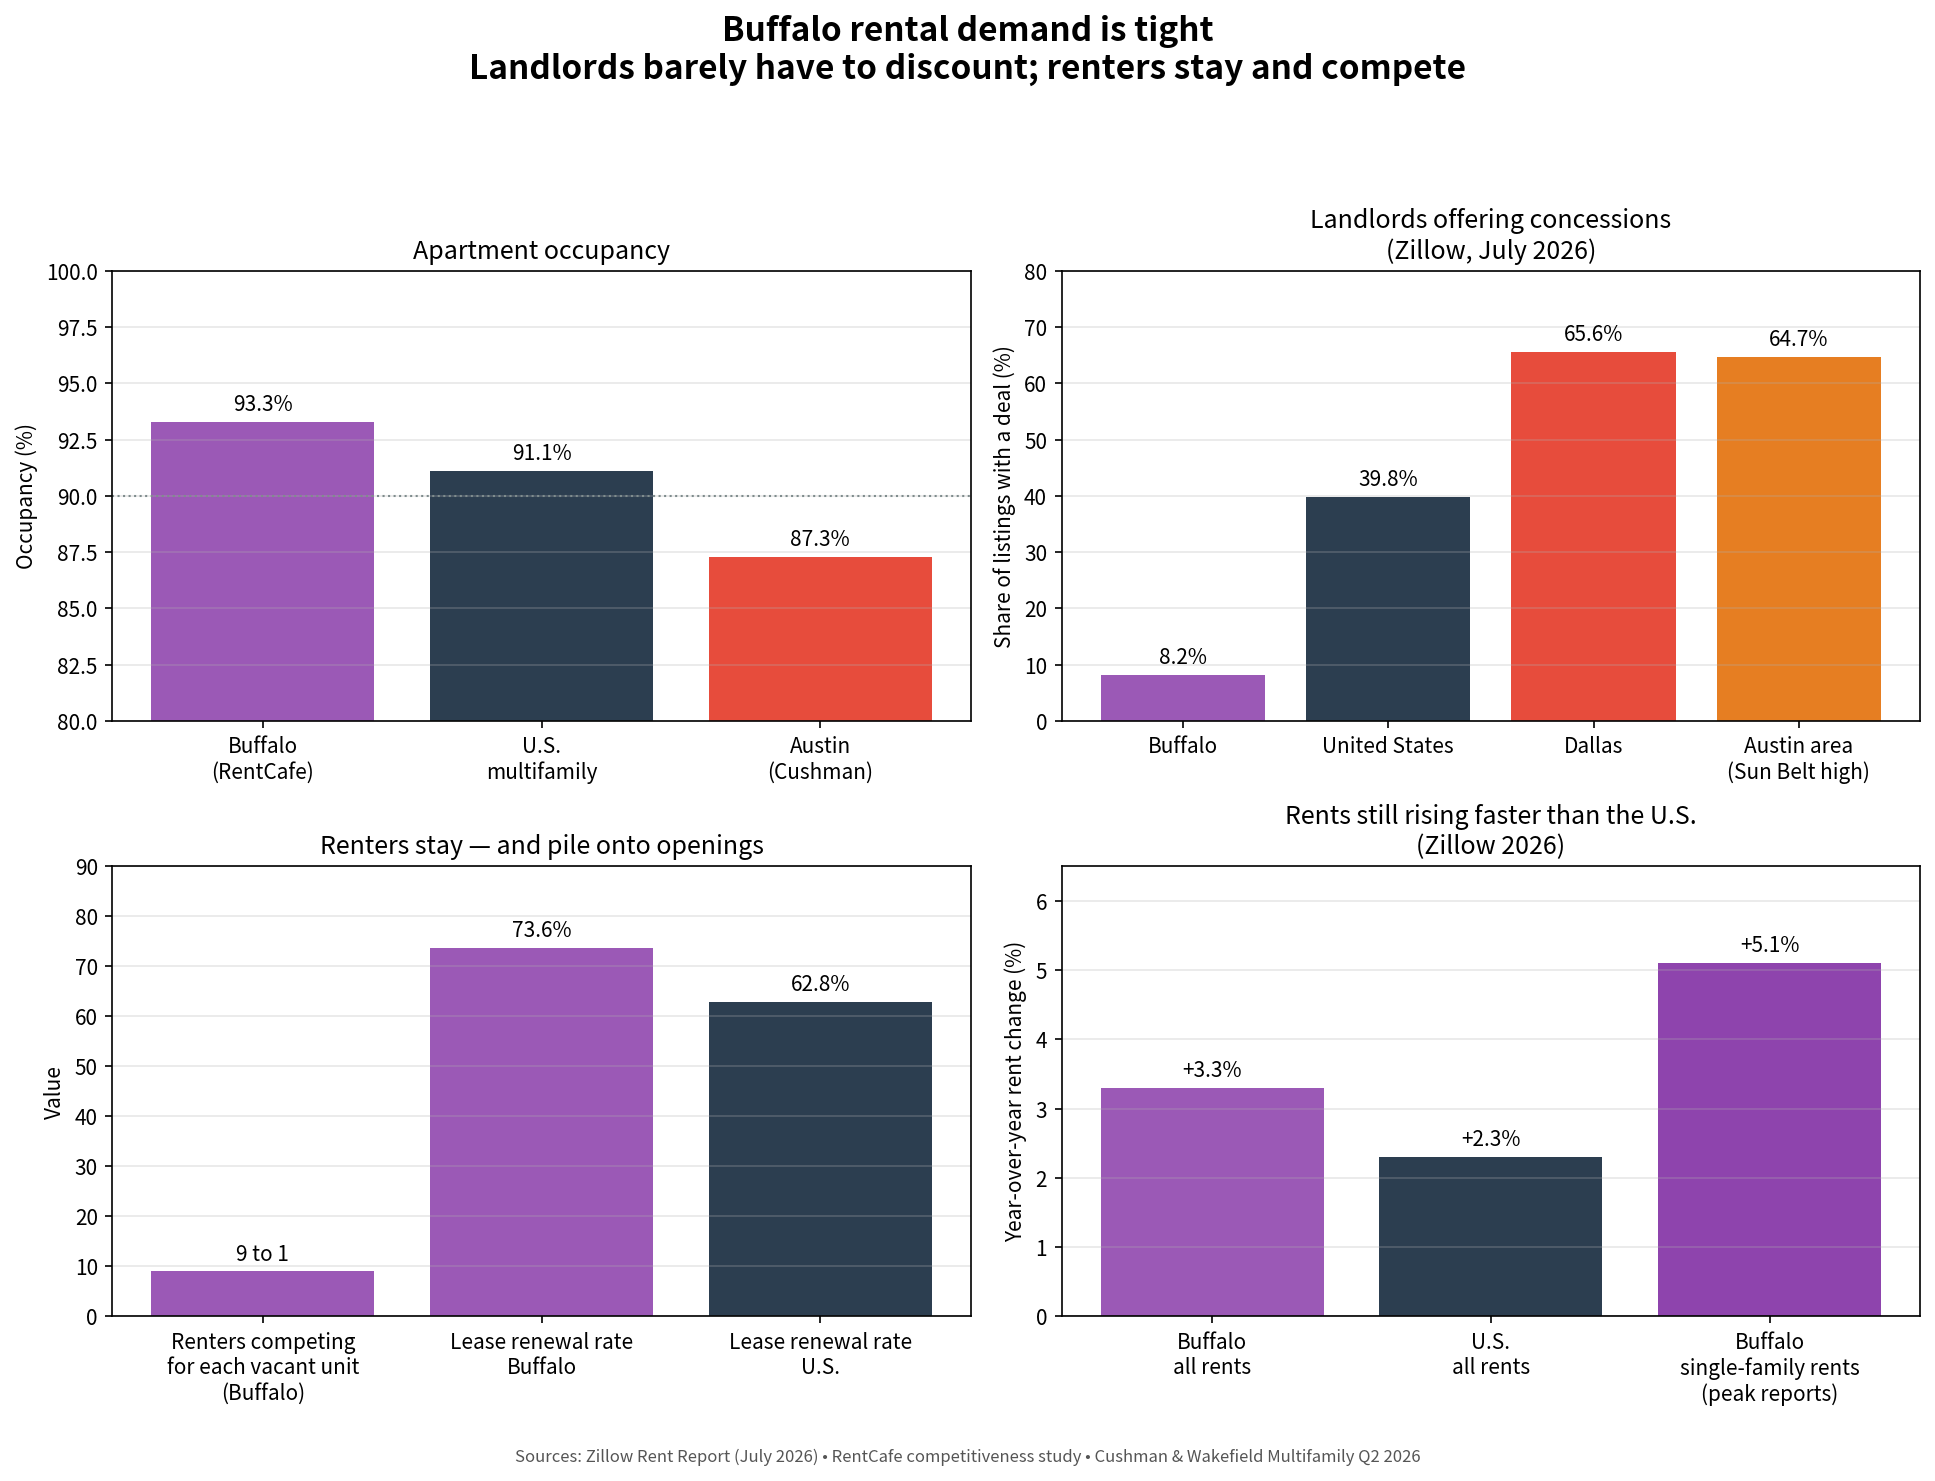
 Rental demand is high and sustained
Buffalo is a tight, low-supply market. Once leased, units stay leased, and owners rarely need to offer concessions to fill them. High occupancy, low concessions and above-average rent growth together form the demand signal.
 Tap the chart to view it full size
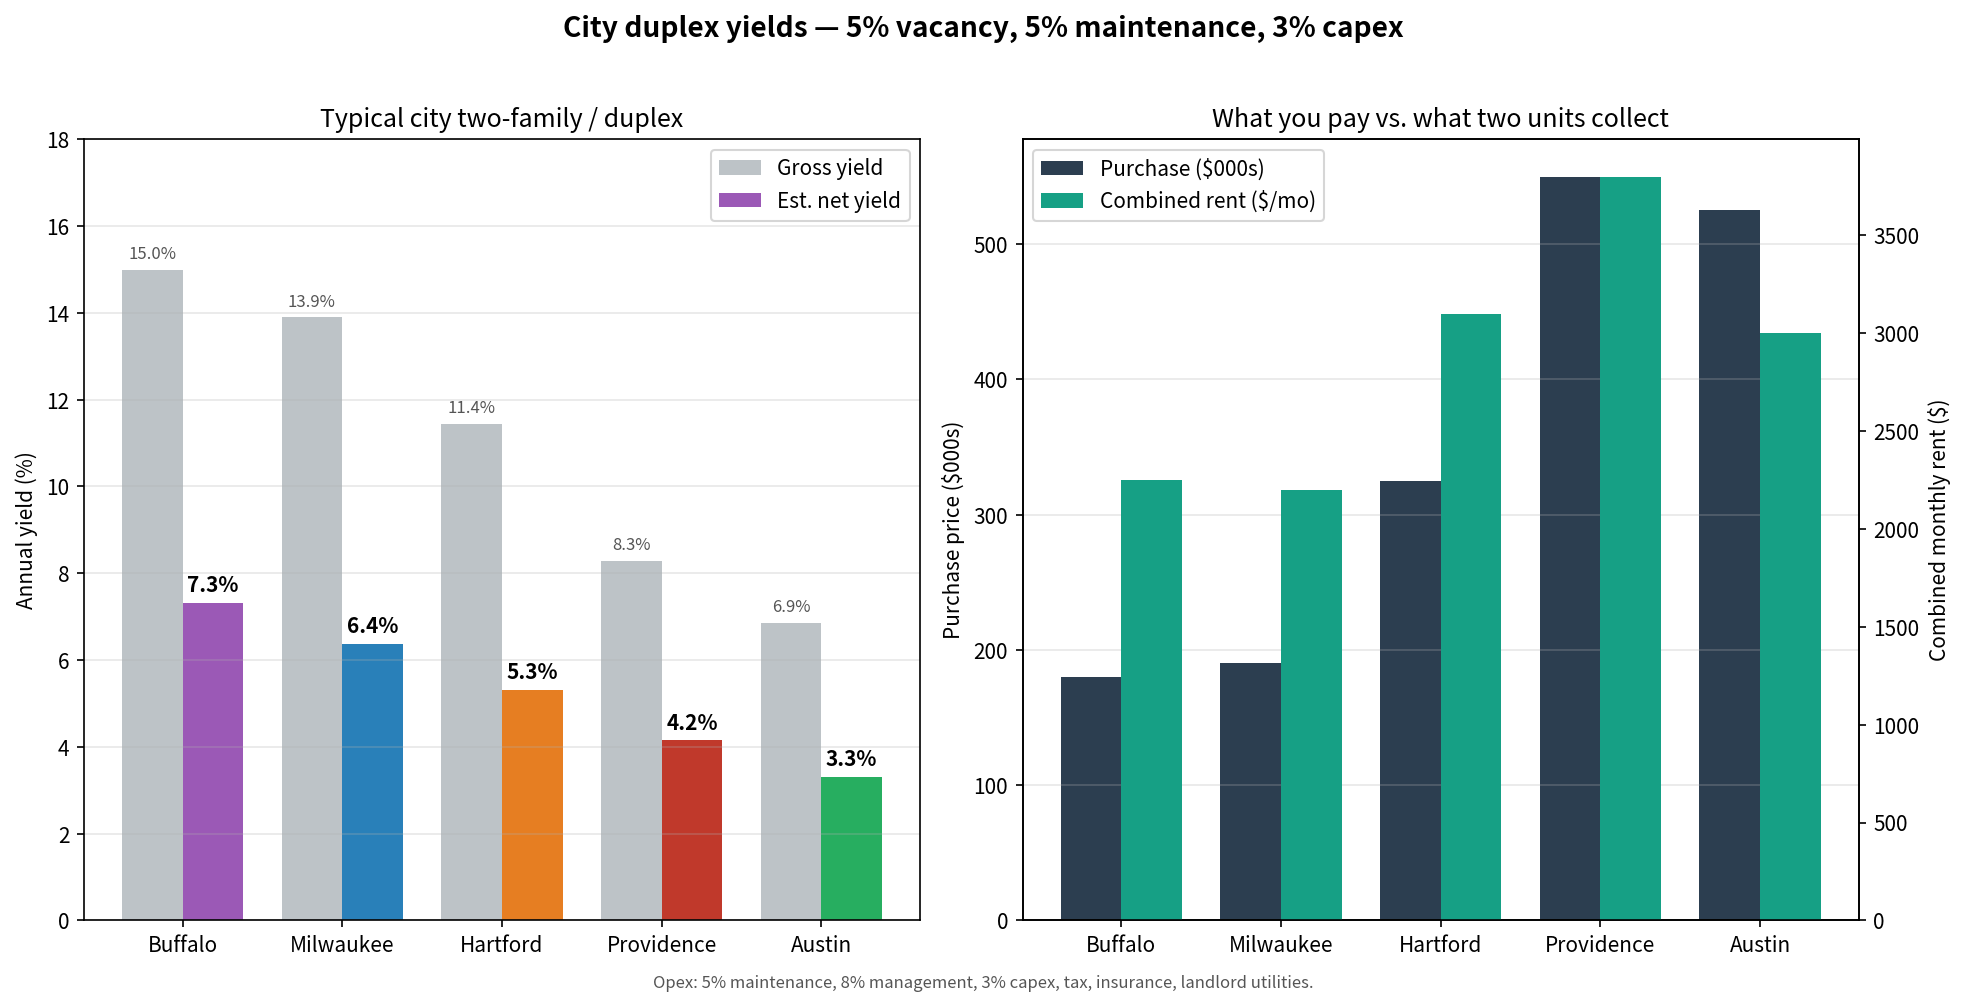
 Yields compare well with peer cities
On a like-for-like basis, a typical city two-family in Buffalo produces stronger estimated net yields than comparable properties in Milwaukee, Hartford, Providence or Austin, once vacancy, maintenance and capital expenditure are accounted for.
This chart illustrates the wider market using published data and stated assumptions. It is not a projection of the return on any property acquired through Abbotsinch, and individual outcomes vary materially by asset, condition, financing and timing.
 Tap the chart to view it full size
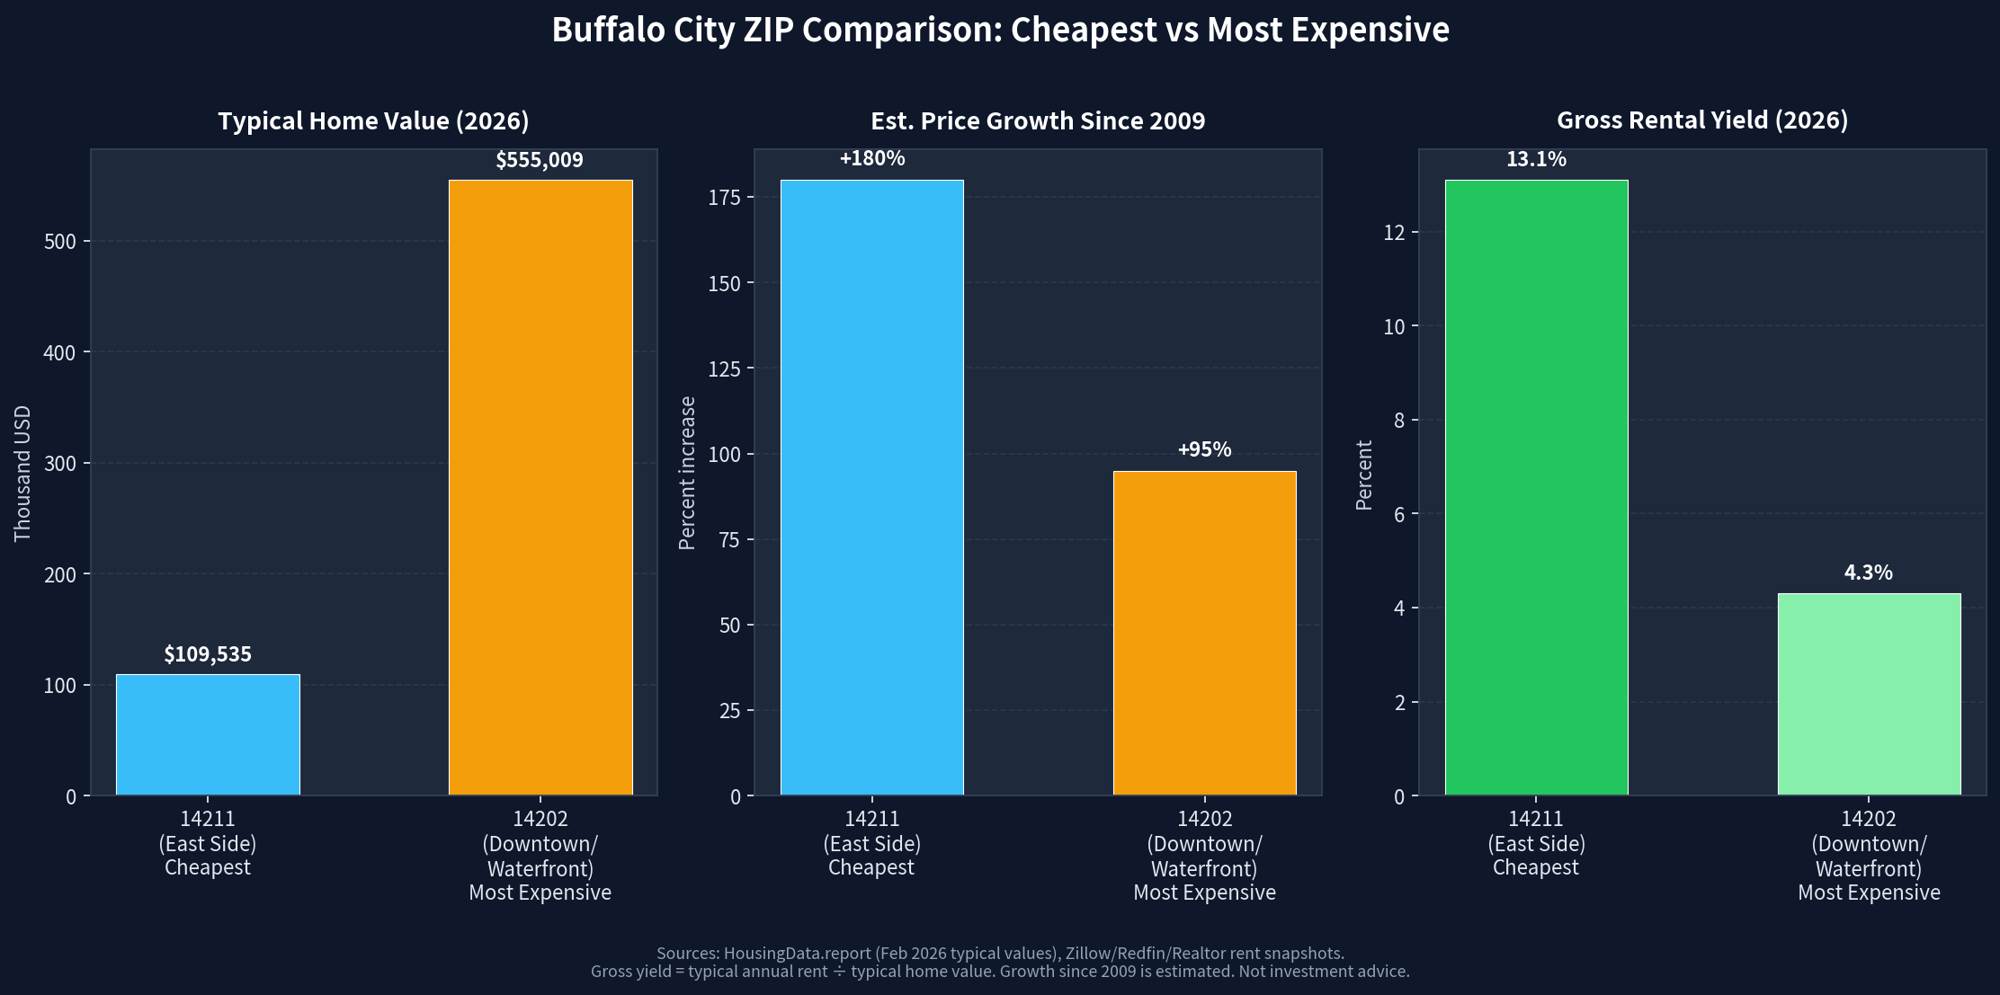
 We invest street by street
Granular analysis matters here. We do not invest at the city level; we invest in specific micro-markets, neighbourhoods and individual assets. Different ZIP codes within the same city show vastly different value, growth and yield profiles.
 Tap the chart to view it full size
 Next step
Start with a call.
Whether you are investing for the first time or already hold property, and whether you are in the US, the UK, Ireland, Canada or elsewhere — it starts with a conversation and some decision-making.
Speak to usWhat we will cover
- Your objectives and time horizon
- Capital you are considering allocating
- Your current portfolio, if any
- Where you are tax resident
- Which strategy profile fits